Throughout this lesson, students will think about some questions individually, then share solutions and discuss their mathematical thinking with a partner. Afterwards, the pairs will share their work with the class. This structure, known as think-pair-share, provides students with an opportunity to become actively engaged in learning mathematics.
As a large group, introduce the lesson by discussing the context of successive discounts at a retail store. Solicit input from students who work at retail stores that offer successive discounts and from students who have received successive discounts at a retail store.
Distribute the Successive Discounts Activity Sheet and instruct students to read the context. Tell students that the purpose of the context will be to illustrate the mathematical concept of composition of functions.
 Successive Discounts Activity Sheet
Allow students enough time to complete the first two problems on the activity sheet. Tell students to work individually first, then have them share their solutions with a partner. Instruct students to share with their partners how they determined the solutions.
After students have shared with their partners, as a large group, ask students how they determined the sale price for the jeans. It is likely that students will calculate a 25% discount by multiplying the price by 0.25 and subtracting that amount from the price. For the purpose of creating a function, though, have students think about how to determine the price after a 25% discount with just one operation. If students become stuck while trying to find such a function, ask them to think about how much they pay when saving 25%. Alternatively, you can have students write the final price in terms of the original price and the discount, which should lead to a one-operation function: x−0.25x=0.75x.
After students have discussed solutions and strategies for the first two problems, instruct them to complete Questions 3-6. Again, tell students to work individually first, then have them share their solutions with their partners. Instruct them to share with their partners how they determined the solutions. If students ask if their answers are correct during the partner time, ask students to discuss with their partner whether or not their answers make sense. Allow partners time to discuss the process. After students have shared with their partners, ask the class to share the functions that they wrote. Allow plenty of time for discussion. Ask students if they have different algebraic representations for any of the functions. Focus on the process of applying one function first, and then applying another function second.
Solutions to Questions 1-6
- $23.25
- $22.00
- f(x) = x - 5
- g(x) = 0.75x
- r(x) = 0.75x - 5
- s(x) = 0.75(x - 5)
Instruct students to use a graphing calculator, such as Desmos, to examine a graphical representation of the situation. Individually, students should complete Questions 7-8. After students have completed these questions, instruct them to share their graphs with a partner. Have students share their reasons for choosing a particular domain. After students have shared with a partner, as a large group have students share their domains. Tell students that it is acceptable to have different domains, as long as they are reasonable based on the context. [A reasonable domain will not include negative values, and it will be large enough to include the $36 price of jeans as well as prices beyond.]
Possible Solutions for Questions 7-8
- Domain: [0, 75]
- The image below shows a sample viewing window, with XMIN=0, XMAX=75, YMIN=0, YMAX=75:
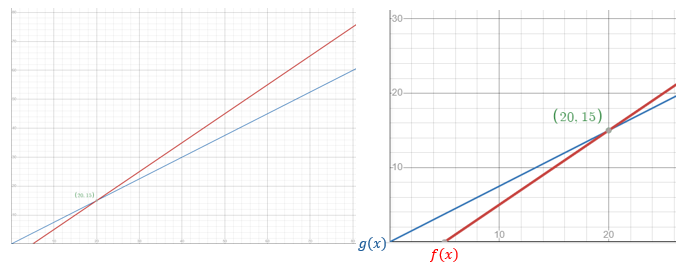
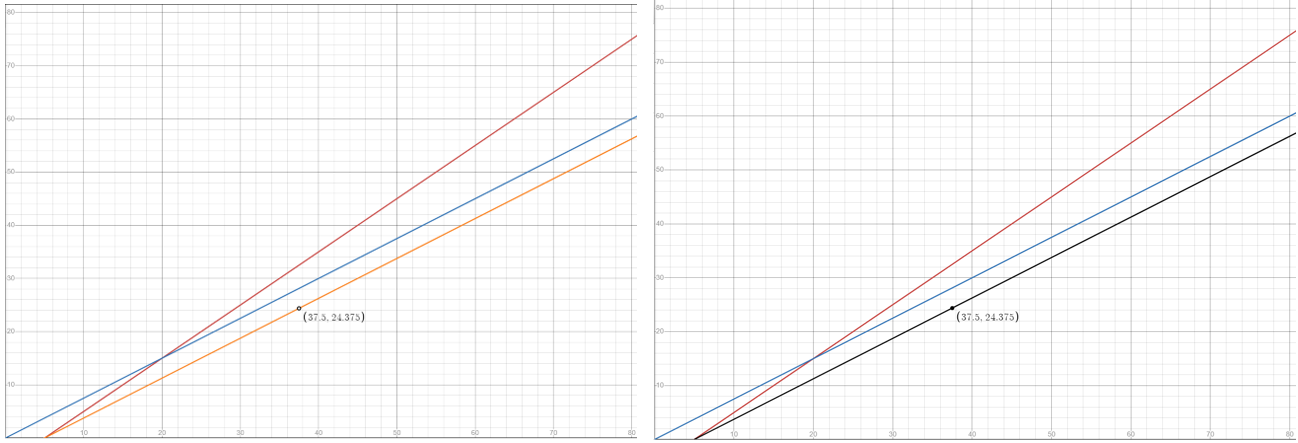
Individually, students should complete Question 9 on the activity sheet. Students can use Desmos to identify the point of intersection. Ask students about the significance of the point of intersection. Students should determine that the point of intersection represents the point at which the sales price of jeans with just the 25% discount is equal to the sales price with just the $5 off coupon.
Sample Graph for Question 9
- The Desmos graph will show the intersection near x=20 and y=15.
Questions 10-13 on the activity sheet connect the lesson to composition of functions.
Instruct students to work with a partner on Questions 10-13. Allow students plenty of time to discuss how to use only y1 and y2 to write equivalent representations for r(x) and s(x). If students are having difficulty, have them think about the order in which the discounts are applied and which discounts y1 and y2 represent. To review Questions 10-13, have two groups of partners combine to make groups of four. Have the groups share their functions and graphs. After students have worked in groups, review answers as a large group. Have students explain why the functions y=y1(y2) and y=y2(y1) are equivalent to y=r(x) and y=s(x), respectively.
Solutions for Questions 10‑13
- The graph of y = r(x) will always fall below the graphs of y1 = f(x) and y2 = g(x) when y ≥ 0, because two discounts will result in a lower price than only one discount.
- The function y = r(x) is equivalent to the function y = y1(y2). In this case, y2, which represents the 25% discount, is applied first, and y1, which represents the $5 off, is applied second. The significance of the graph is that since the functions y = r(x) and y = y1(y2) are equivalent, they will produce the same graph. When two functions produce the same graphs, the graphs overlap. Students can use Desmos to move along the graphs of y = r(x) and y = y1(y2) to convince themselves that the lines actually overlap.
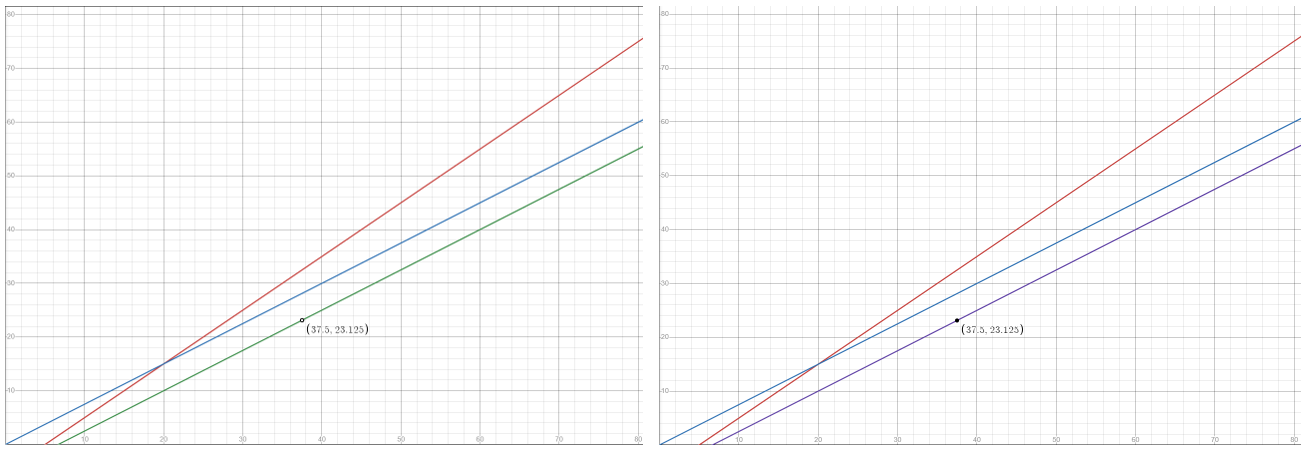
- The graph of y = s(x) will always fall below the graphs of y1 = f(x) and y2 = g(x) when y ≥ 0, because two discounts will result in a lower price than only one discount.
- The function y = s(x) is equivalent to the function y = y2(y1). In this case, y1, which represents the $5 off, is applied first, and y2, which represents the 25% discount, is applied second. The significance of the graph is that since the functions y = s(x) and y = y2(y1) are equivalent, they will produce the same graph. When two functions produce the same graphs, the graphs overlap. Students can use Desmos to move along the graphs of y = r(x) and y = y2(y1) to convince themselves that the lines actually overlap.
To connect the graphical representation to the algebraic representation, tell students that by applying the functions f(x) and g(x) in succession, they have created compositions of the two functions. On Questions 5 and 6, have students use f(x) and g(x) instead of y1 to write equivalent expressions for r(x) and s(x). Students should arrive at the following: r(x) = f(g(x)) and s(x) = g(f(x)).
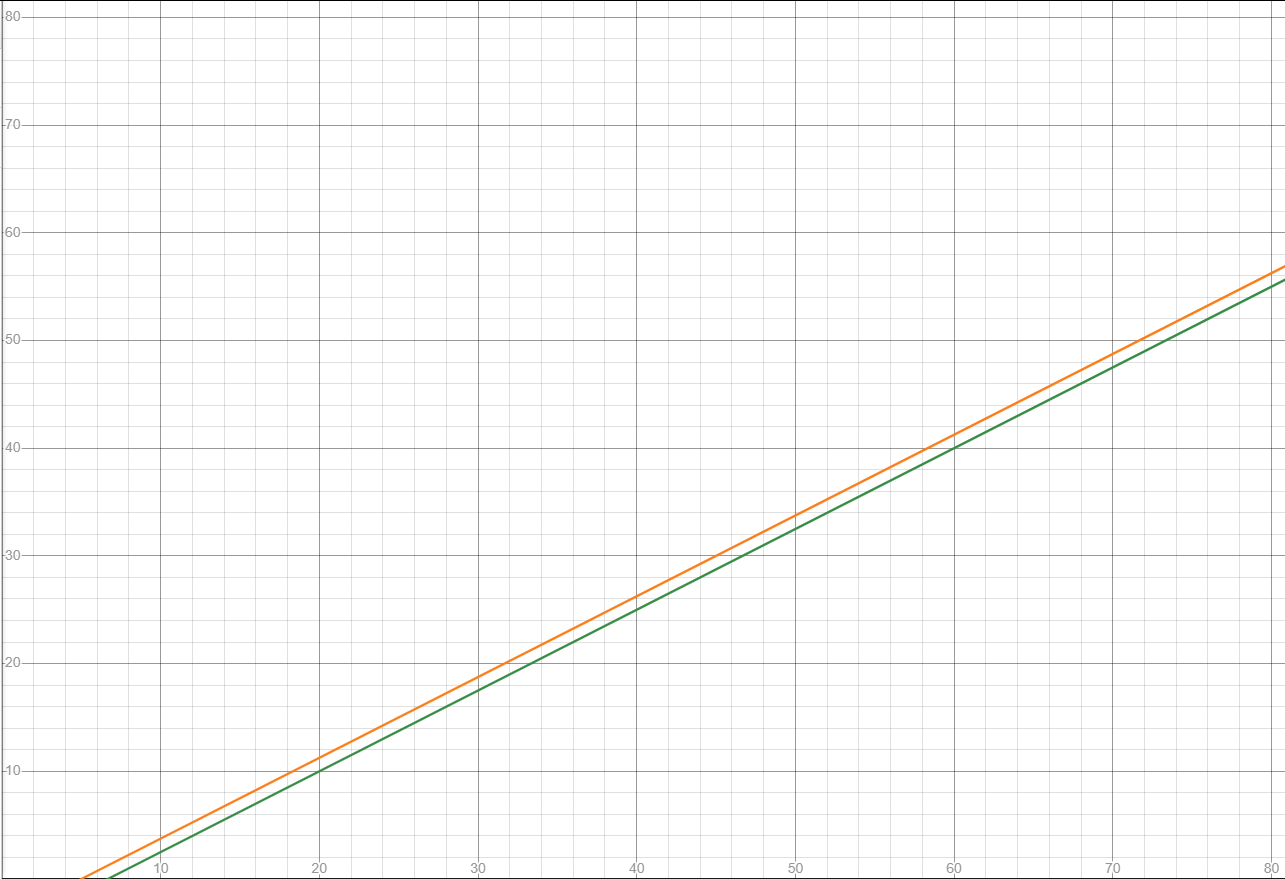
Question 14 can be used as a concluding activity for the lesson. Students should realize that applying the percent discount first will result in the lowest price, because the percent discount is taken from a larger amount.
Solution to Question 14
If y = r(x) and y = s(x) are graphed in the same viewing window, the lines are parallel and s(x) > r(x), which means that the sales price represented by the function y = s(x) will always be greater than the sale prices represented by the function y = r(x), although the difference is small. Students should notice that the sales price of the jeans will always be $1.25 less if the percent discount is taken first. This result can be verified algebraically by subtracting: r(x) - s(x) = 0.75x - 5 - [0.75(x - 5)] = 0.75x - 5 - 0.75x + 3.75 = 1.25.)
